HISTORICAL EVIDENCE01
25OPTIONS INDICATORSEach with win rate, mean net return and sample size — for each stock and each of 3 holding periods.


Options Intel
Track options positioning, volatility and hedging pressure through 25 indicators to reduce uncertainty.
 Interpretation, own-history rank, peer rank and momentumHistorical signal outcomes with defined samples and horizonsModelled pressures separated from observed market data
Options-derived pressure is not observed institutional intent or a guaranteed stock-price move.

TRUSTED INPUTS · VERIFIABLE OUTPUTS
Official ContributorVS × IBKR

Webinars, research, and podcast appearances published on IBKR Campus as part of our ongoing partnership with Interactive Brokers.
See all on IBKR Campus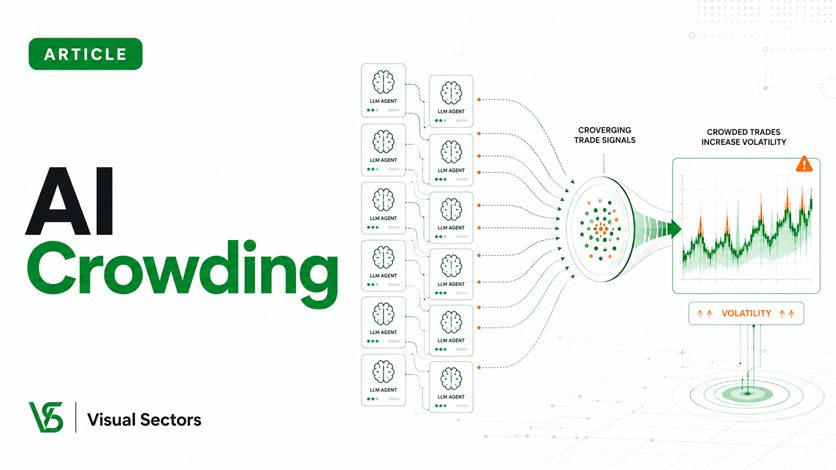 IBKR Quant
VS × IBKR
Can LLM-Based Trading Systems Increase Market Volatility?
IBKR Quant
VS × IBKR
Can LLM-Based Trading Systems Increase Market Volatility?
 Webinar
VS × IBKR
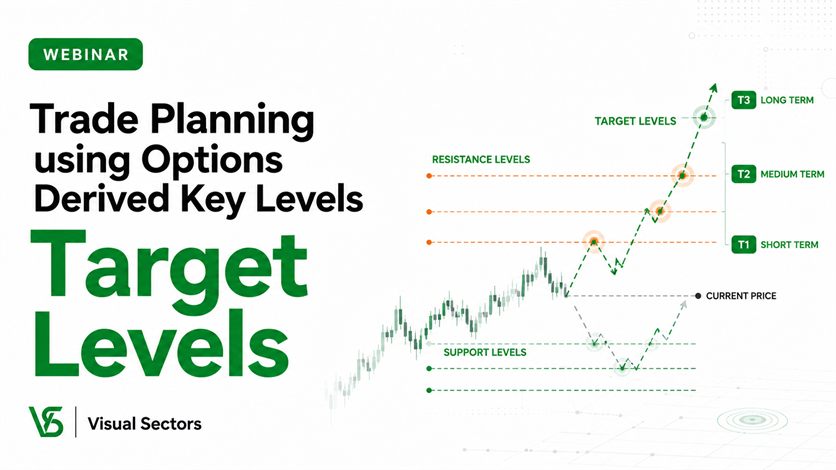
Trade Planning using Options Derived Key Levels
Webinar
VS × IBKR
Trade Planning using Options Derived Key Levels
 Webinar
VS × IBKR
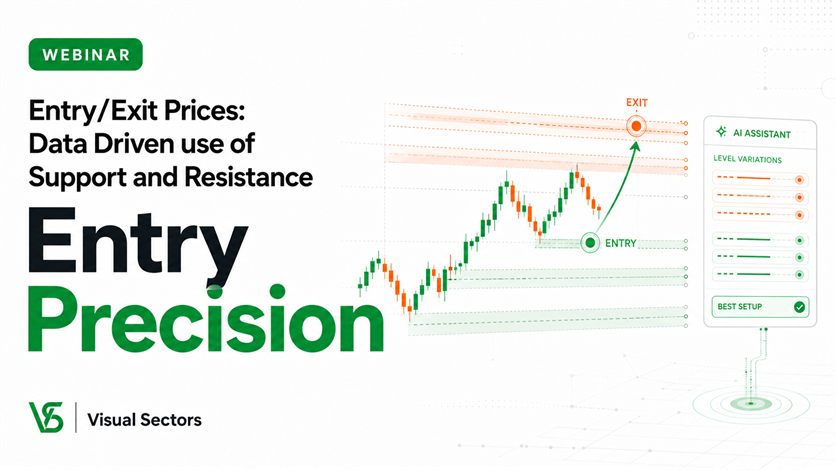
Entry/Exit Prices: Data Driven use of Support and Resistance
Webinar
VS × IBKR
Entry/Exit Prices: Data Driven use of Support and Resistance
 Webinar
VS × IBKR
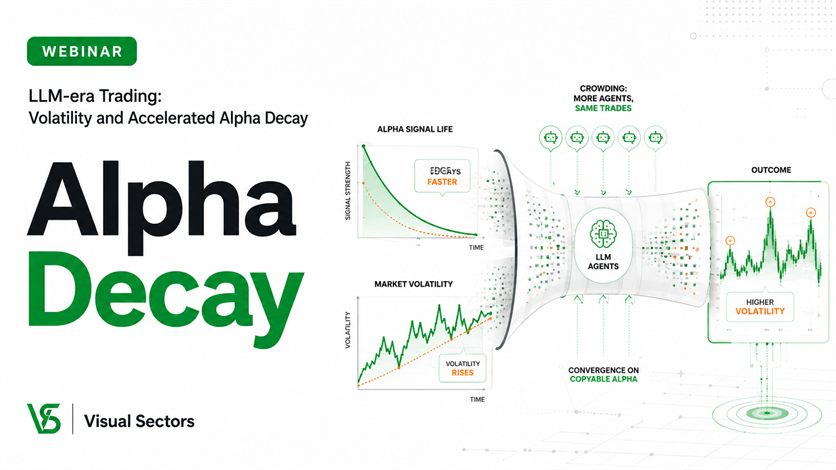
LLM-era Trading: Volatility and Accelerated Alpha Decay
Webinar
VS × IBKR
LLM-era Trading: Volatility and Accelerated Alpha Decay
 IBKR Quant
VS × IBKR
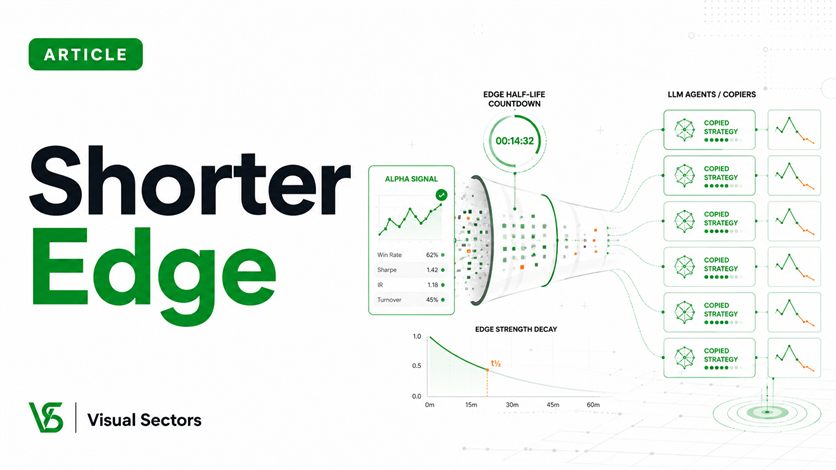
LLMs and the Shortening Shelf Life of Copyable Alpha
IBKR Quant
VS × IBKR
LLMs and the Shortening Shelf Life of Copyable Alpha
 IBKR Quant
VS × IBKR
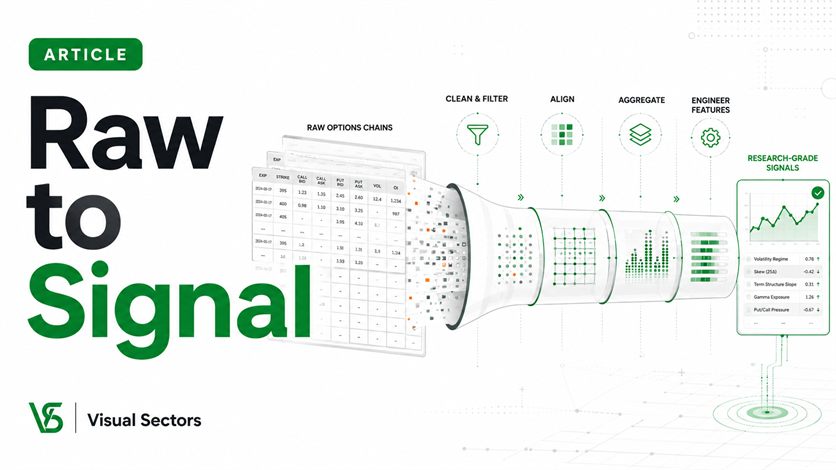
From Raw Chains to Research-Grade Signals
IBKR Quant
VS × IBKR
From Raw Chains to Research-Grade Signals
 IBKR Quant
VS × IBKR
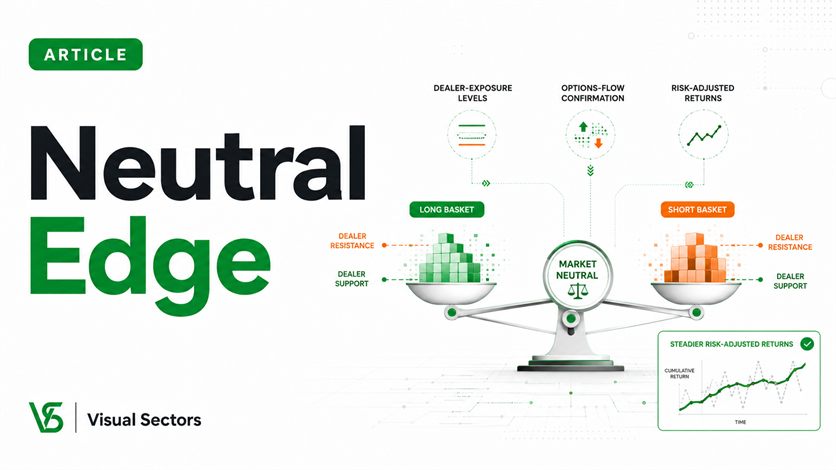
Equity Market-Neutral Trading with Dealer-Exposure Levels and Options-Flow Confirmation
IBKR Quant
VS × IBKR
Equity Market-Neutral Trading with Dealer-Exposure Levels and Options-Flow Confirmation
 Webinar
VS × IBKR
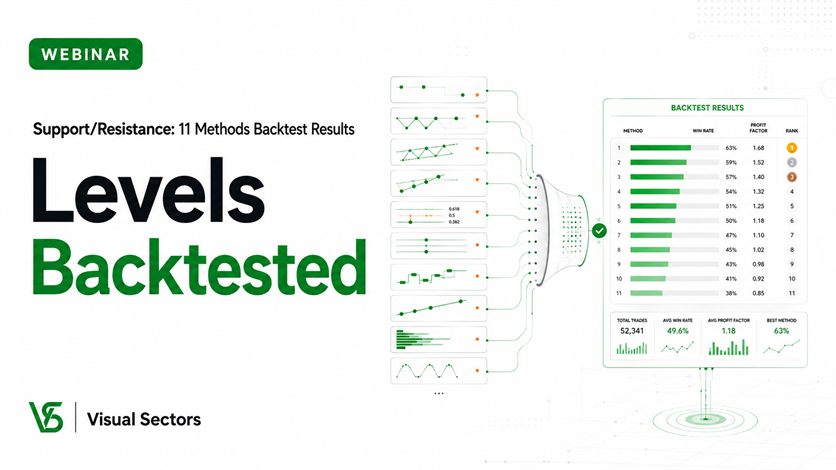
Support/Resistance: 11 Methods Backtest Results
Webinar
VS × IBKR
Support/Resistance: 11 Methods Backtest Results
 Webinar
VS × IBKR
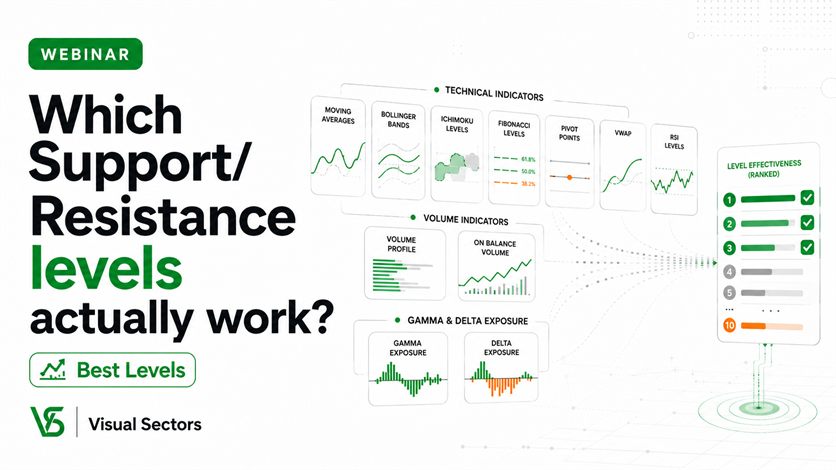
Which Support/Resistance levels actually work?
Webinar
VS × IBKR
Which Support/Resistance levels actually work?
 Webinar
VS × IBKR
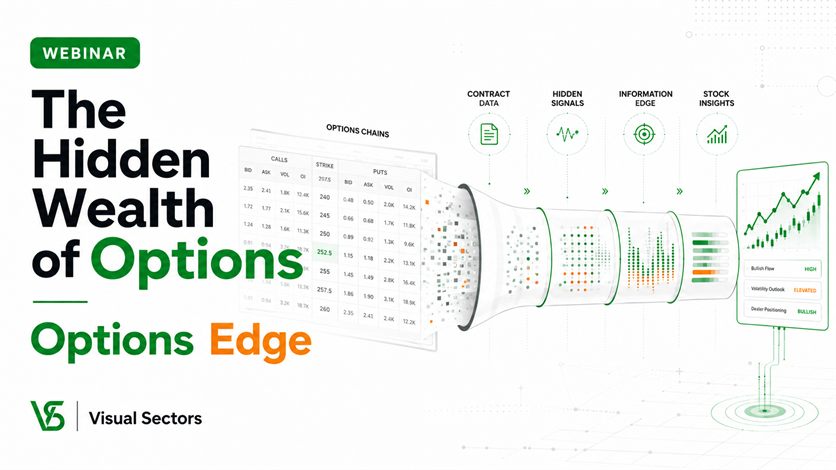
The Hidden Wealth of Options
Webinar
VS × IBKR
The Hidden Wealth of Options
 Podcast
VS × IBKR
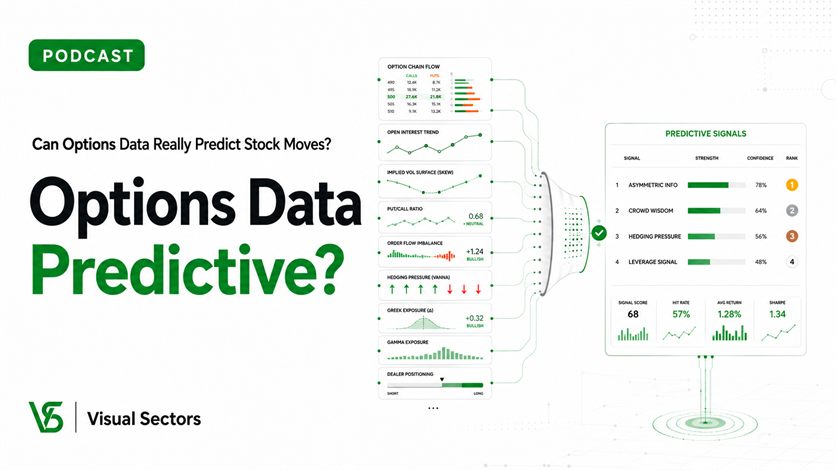
Can Options Data Really Predict Stock Moves?
Podcast
VS × IBKR
Can Options Data Really Predict Stock Moves?
 IBKR Quant
VS × IBKR
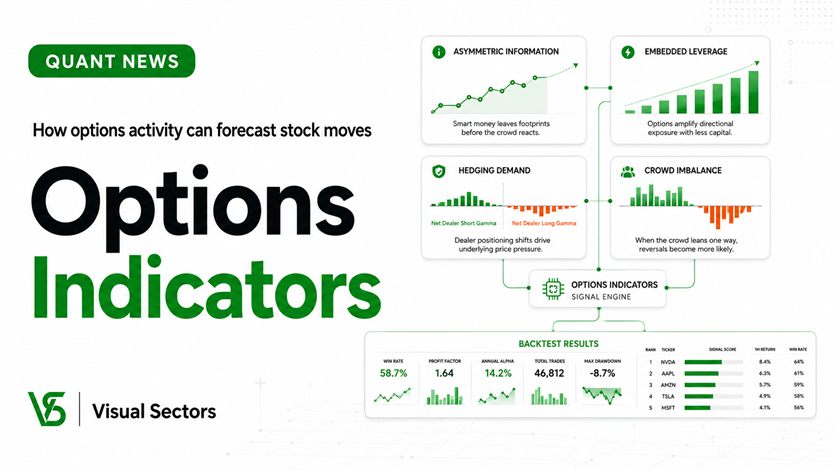
Options Indicators
IBKR Quant
VS × IBKR
Options Indicators
THE PROBLEM · UNCERTAINTY
Clarity comes from knowing how the same signal behaved before — for this stock, this indicator and this holding period.
Each with win rate, mean net return and sample size — for each stock and each of 3 holding periods.
mapping support and resistance with historical hold-rate context
Coverage varies by indicator and stock; where a method leaves a stock out, the page shows why.
OPTIONS-DERIVED INTELLIGENCE
Four signals on every indicator. Read its direction, place it in context and track how it is changing.
ILLUSTRATIVE EXAMPLE · NOT A CURRENT READING
The indicator's bullish, neutral or bearish reading.
Today's percentile against the same stock's readings over the last 14 years.
Today's percentile compared with other stocks at the same time.
A 0–100, RSI-like oscillator tracking how the indicator's value is changing.
Percentile rankings describe context, not win rates. Historical performance is shown separately.
A COMPLETE DECISION FLOW
Use the same evidence through each step instead of rebuilding context in disconnected tools.
Filter by signal direction, historical ranking, peer ranking and momentum.
SCREEN · SAVE · PRIORITISECombine options intelligence, levels, sentiment and the latest narrative.
COMPARE · EXPLAIN · DECIDETrack weakening signals, broken levels and thesis-invalidating news.
WATCH · REASSESS · ACTTHE REST OF YOUR RESEARCH DESK
See where price can react, what story is moving it and what the full evidence says.
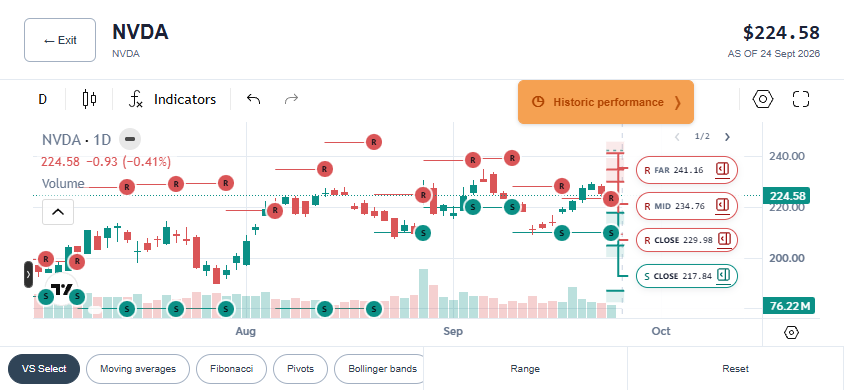
SUPPORT / RESISTANCE
Current level chips, previous levels and the Historic performance control — together on the native chart.
ILLUSTRATIVE EXAMPLE · NOT A CURRENT READING
NEWS + 3D SENTIMENT
Compare competing narratives with the positioning shown in the 3D sentiment chart.
ILLUSTRATIVE EXAMPLE · NOT A CURRENT READING
Inflation relief and softer yields keep risk appetite intact; three stories reinforce this read.
Semiconductor weakness and late-session hedging are the strongest counterweight to the lead story.
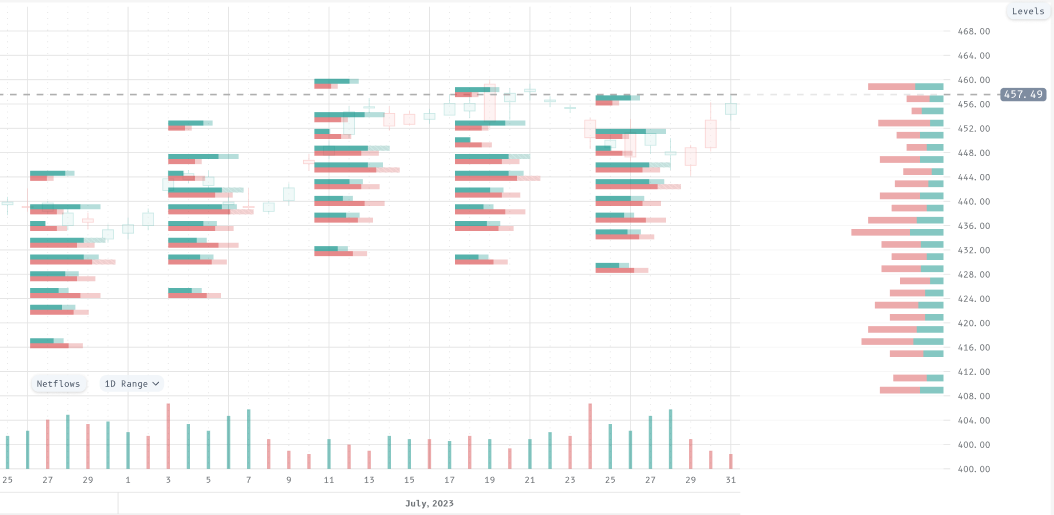
ASK ALFRED
Ask what changed, why a level matters, where signals disagree or what would invalidate the thesis.
ILLUSTRATIVE EXAMPLE · NOT A CURRENT READING
Chart, N1, and all five story summaries are included
N1 supports disinflation; N2 and N3 form the challenger. The chart remains bearish near $460–462, so story leadership and positioning still disagree.
GENEROUS FREE ACCESS
Open 20 complete reads each month. See the signal, its context and historical evidence — then decide whether the workflow earns a place in your process.
NO CARD · 20 FULL READS / MONTH · TRADE ANY INSTRUMENT
INSTITUTIONAL ECOSYSTEM
Independent infrastructure support alongside an open, named team and public research.

Why trust us
 Carlos SalasData Science
 Anton VaninData Engineering
 Alex Kurinets, CFA, FRM, CAIAQuant Research
 Rustam IskenderovData & Distribution
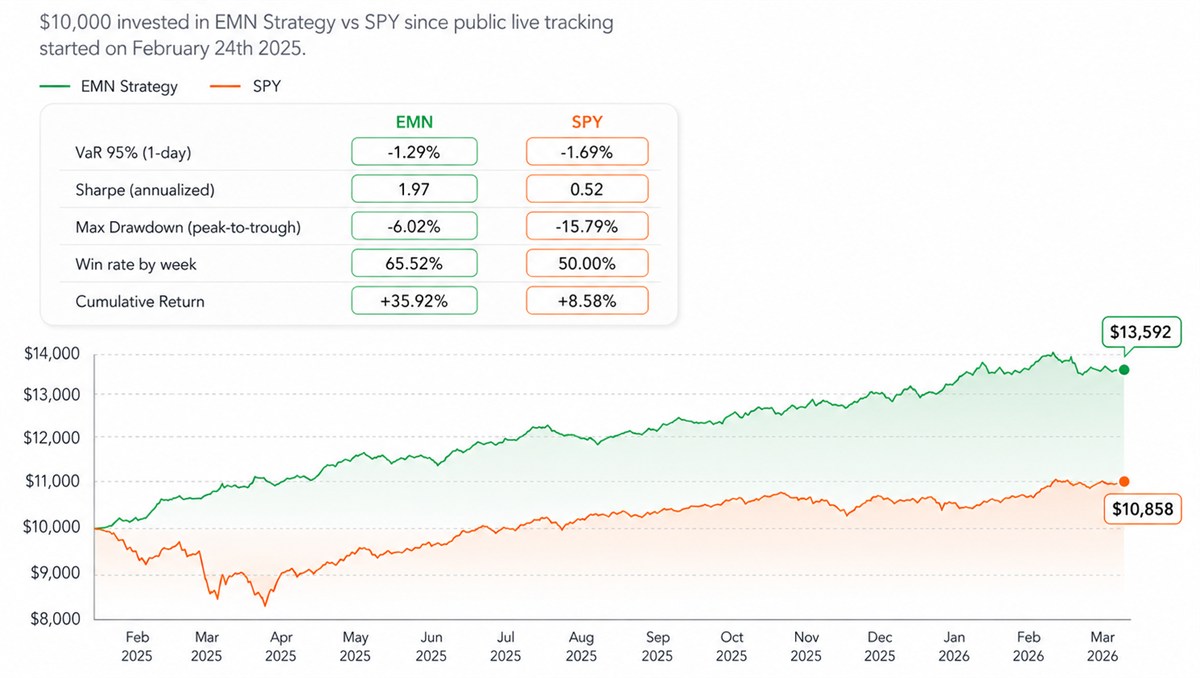
Market-Neutral Strategy
Live for 13 months. +35.92% vs SPY +8.58%.
Publicly tracked since 24 Feb 2025. $10,000 in the EMN strategy vs SPY — higher Sharpe, lower drawdown, higher win rate, lower VaR.
Proprietary options-derived indicators
Machine-learning models in production
Backtests performed
Started with a $4,000 account and inconsistent results. The first 15% month became my a-ha moment — Visual Sectors data has helped me return more than 30% in 2025 so far.
Ten success stories of Visual Sectors users — how the product evolved to help traders get better, more consistent results, and exactly how it made money for our customers.
I didn't have a lot of trading experience when I attended the Market-Neutral workshop. A couple of weeks later I was able to lock in profit just following a simple 3-step process.
Visual Sectors models deliver strong returns on multiple occasions, and the risk profile of the strategies allows trading stocks with a valid mathematical expectation of positive returns.
Each statement is one person’s experience. Individual results vary and do not guarantee future returns. Identity and consent verified for all testimonials.
MORE USER TESTIMONIALS
GIFs and shared results from the Market-Neutral community.
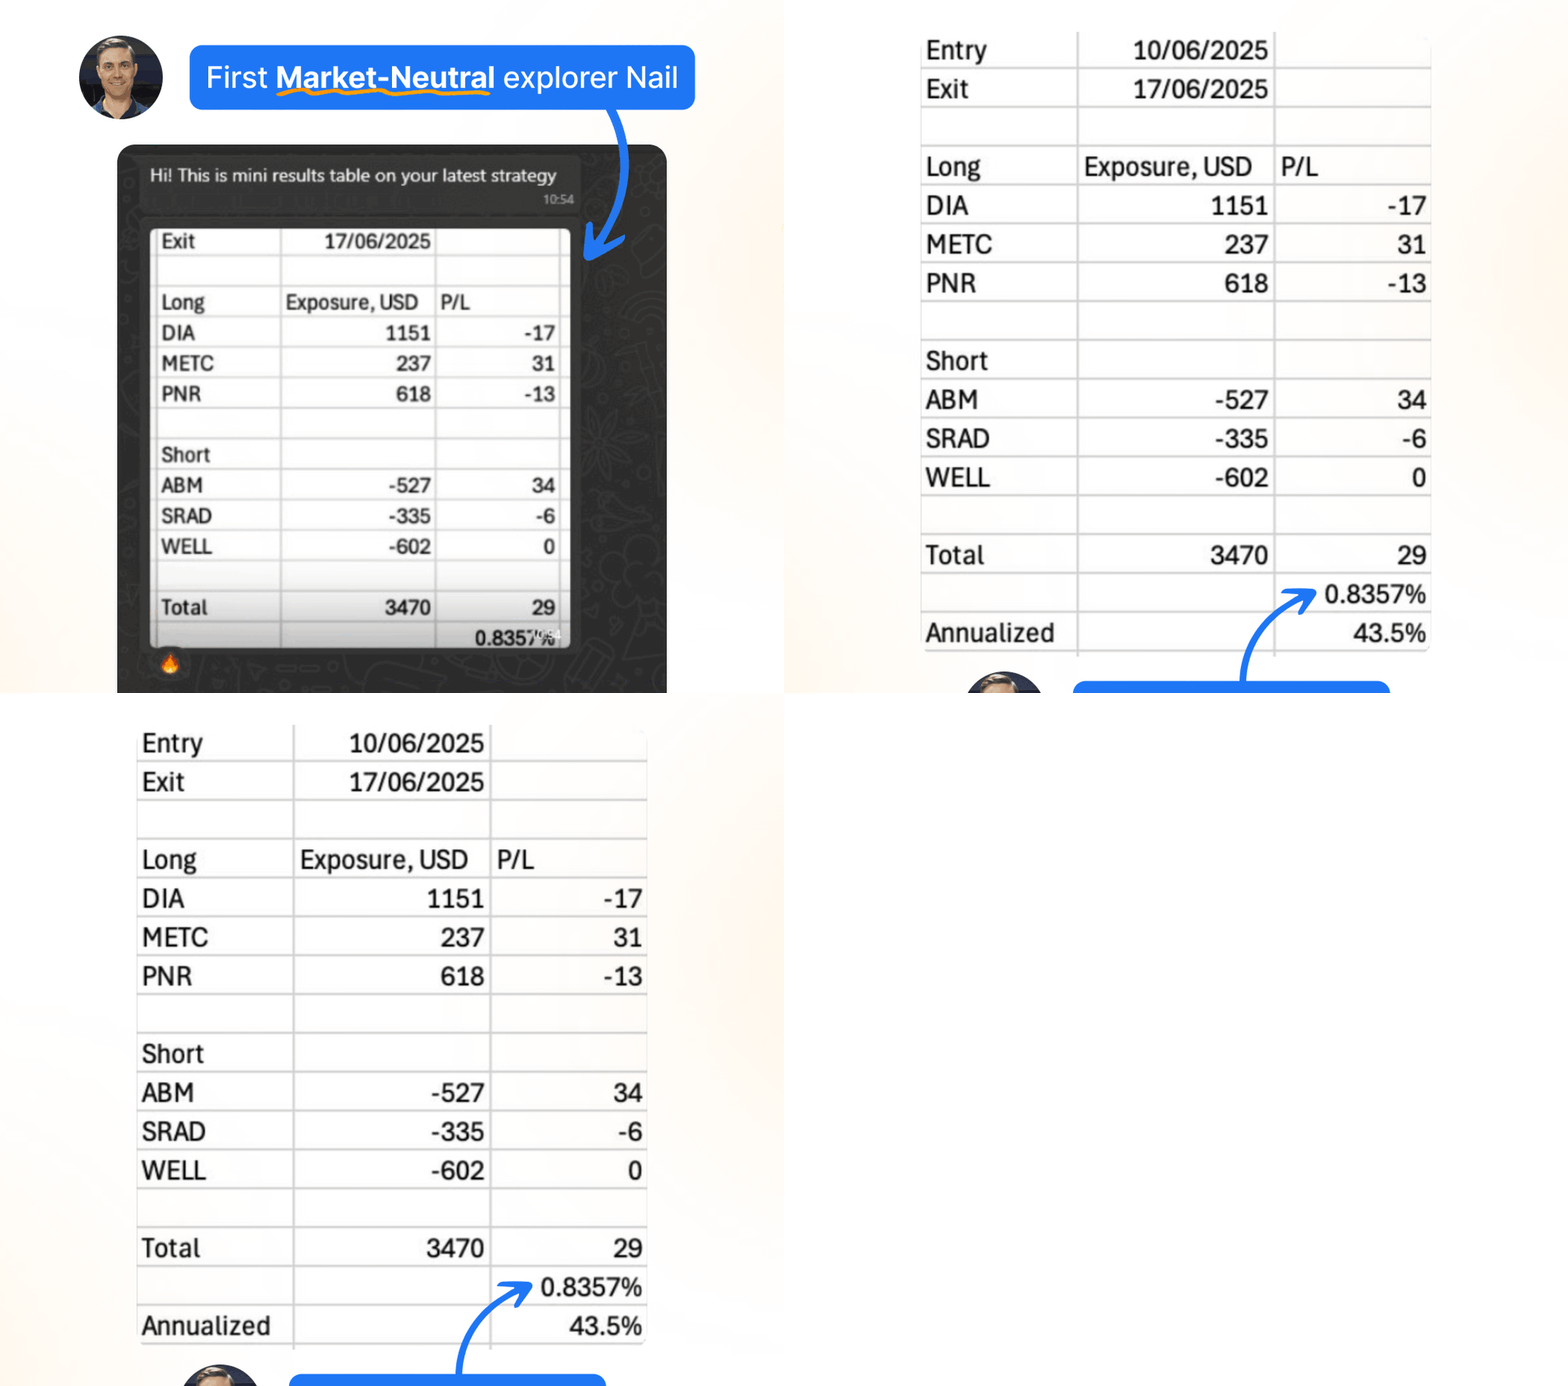
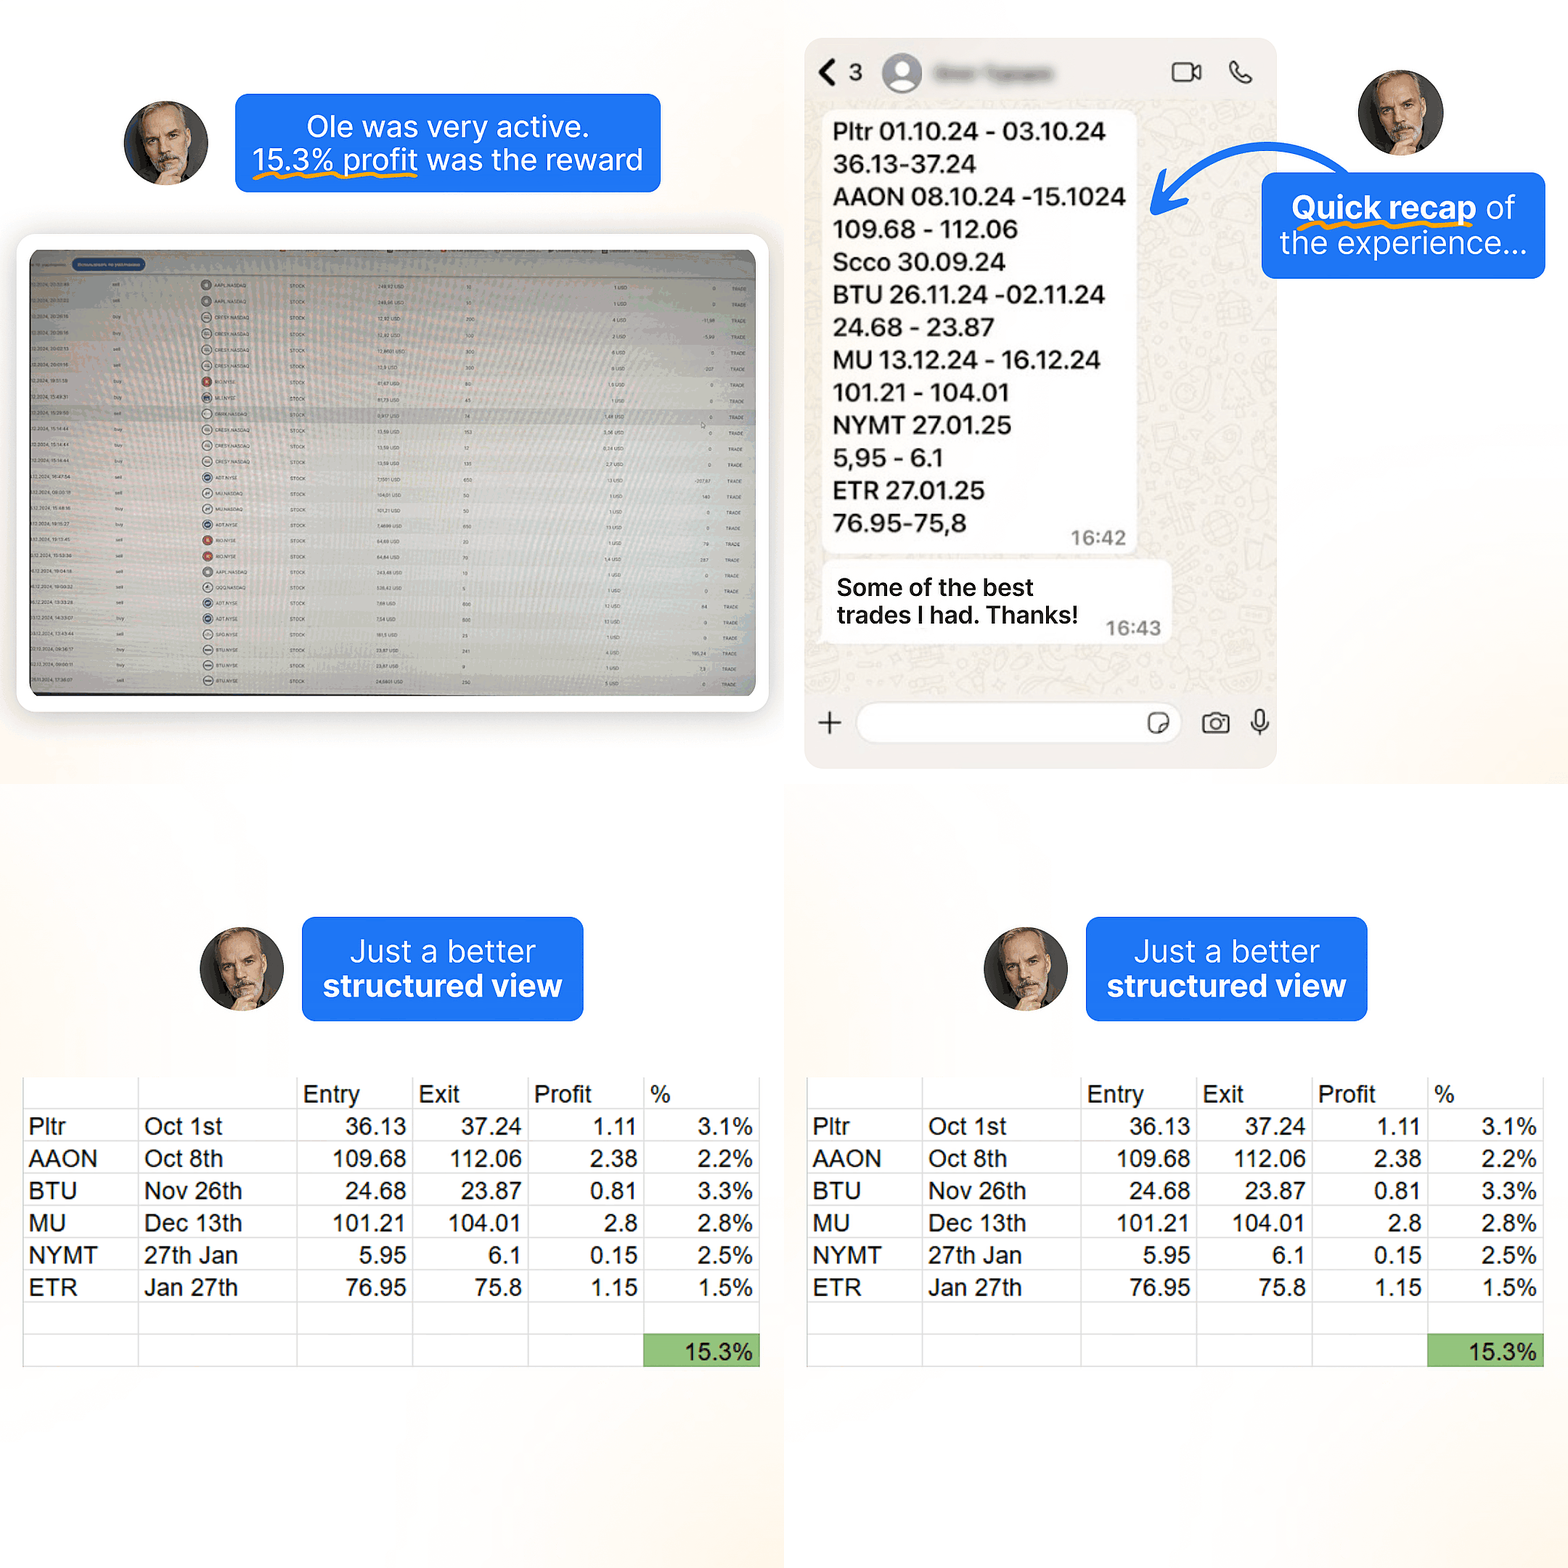
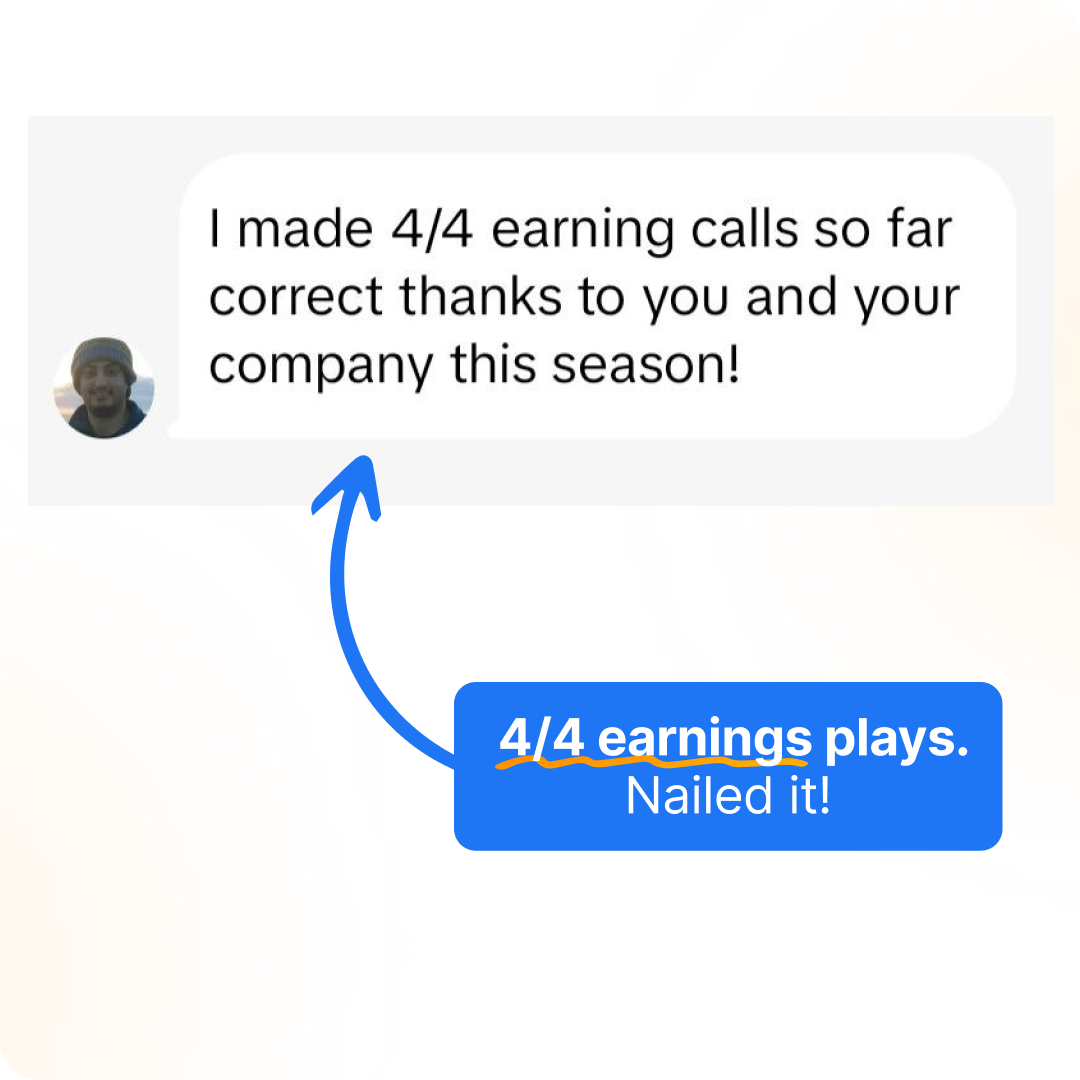
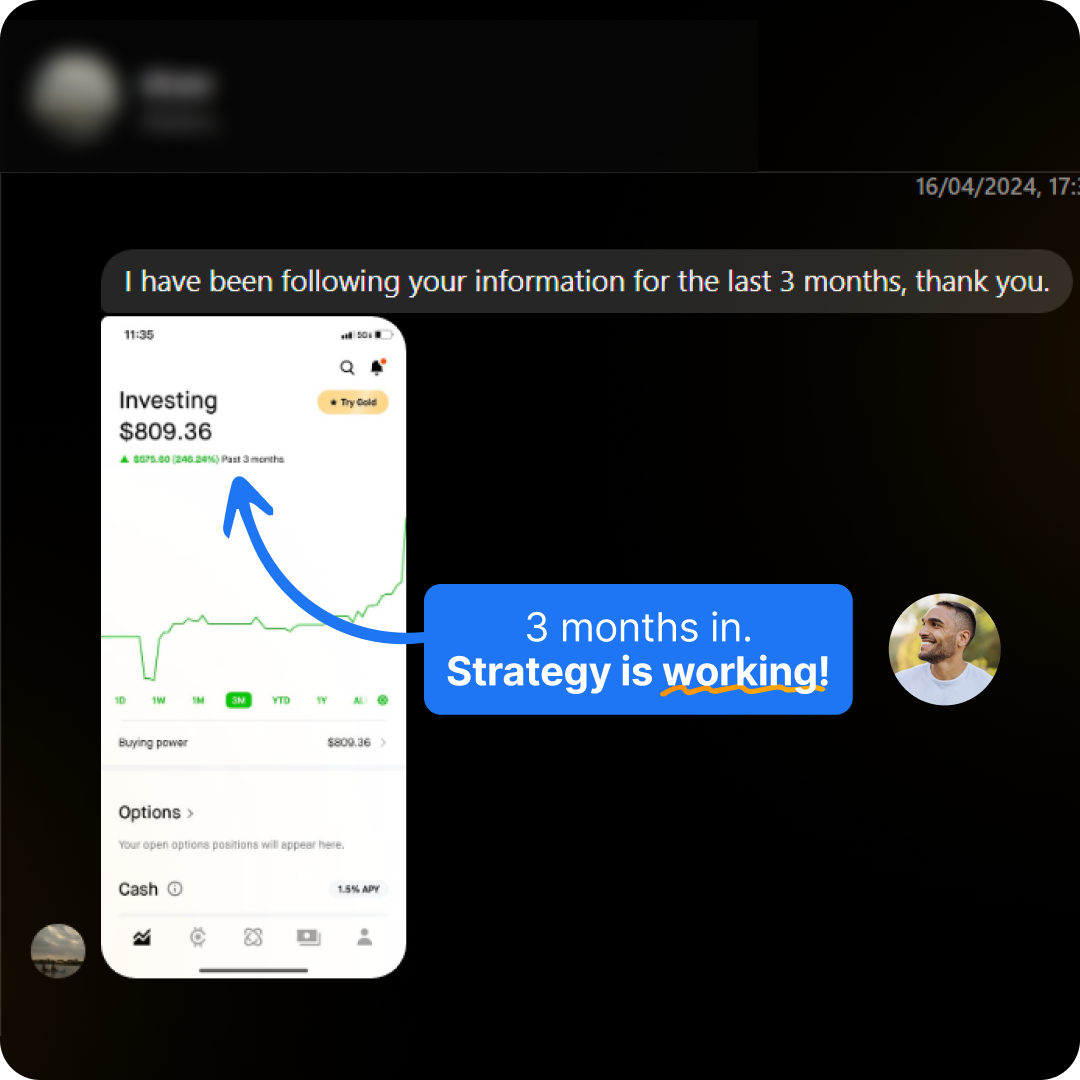
FOUR USERS' OWN POSTS, SHARED WITH THEIR PERMISSION AND CHOSEN BY US. WE DO NOT MEASURE USERS' TRADING RESULTS; THESE ARE NOT TYPICAL AND DO NOT PREDICT YOURS.
BEFORE YOU OPEN THE PLATFORM
You do not need to trade options. The options market is the source of intelligence. Apply the context to stocks, ETFs, futures, options — or simply to timing and risk.
No. Options-derived means the intelligence is sourced from options-market behavior. You choose the instrument.
Win rates, mean net returns and observation counts for the same stock, indicator and holding period. Historical results describe prior samples; they do not guarantee future performance.
No. It includes 20 complete reads per month, including the current signal, context and historical evidence. No card is required.
No. Visual Sectors publishes measurements of what has already happened in market data. You make every decision.
Screening and watchlists, support and resistance levels, news and 3D sentiment, workflows, and Alfred grounded in the current research page.
25 indicators · 6 research groups
Options-derived pressure is not observed institutional intent or a guaranteed stock-price move.
Options Intel
Read the signal, its historical context and its limits before adding it to a trade plan.
Free · $0 a month
20 runs a month, reset on the 1st (New York)The Screener and every screen you saveSupport & Resistance on every tickerThe summary at the top of any stock pageSPY on every tab, every dayor
Check your email
Google only for now
Please try that once more
The security check could not load
Something on this network or in this browser is blocking challenges.cloudflare.com, so the emailed link cannot be requested here. Continue with Google, or allow that address and reload.
That did not send
The sign-in request could not be sent. Nothing was emailed.
Options-derived pressure is not observed institutional intent or a guaranteed stock-price move.